Kiosk Summary Page
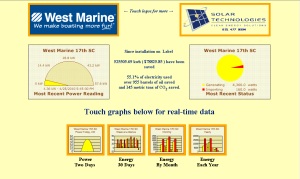
This is the rMeter™ 'Kiosk' view. It is an 'at a glance' summary of your
system's electrical use and production. Each of the small graphs is a clickable
(or touchable) button taking the user to a more detailed page.
|
|
|
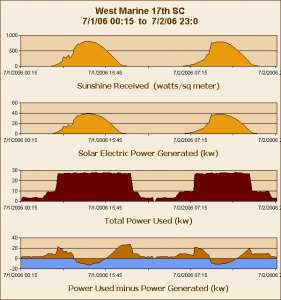
Two Day Graphs
View the solar irradience, solar power generated, and electricity consumed,
and net electricity consumed over the past two days.
|
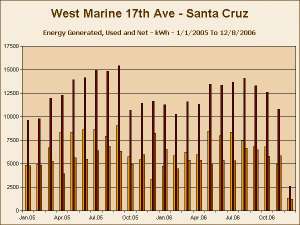
Daily or Monthly Graphs for thirty periods
This chart shows energy produced, used, and net by day over a month. View
the data in kWh, dollars, carbon dioxide saved, or barrels of oil equivalent.
|
|
|
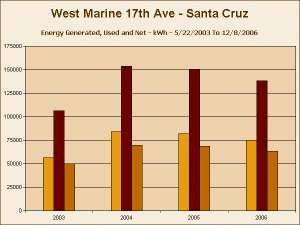
Yearly Graphs
This chart shows energy produced, used, and net by year. View
the data in kWh, dollars, carbon dioxide saved, or barrels of oil equivalent.
|
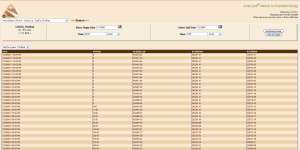
Download Data for Your Own Analysis
Custom reports are also available.
|
|
|
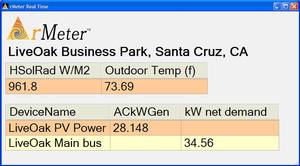
rMeter™ Real Time
rMeter™ Real Time is a Windows Application that runs on an Internet connected PC.
It can be configured to update as frequently as every two seconds. The data is
stored in a SQL database to provide extremely fine grained analysis of the
measurement(s) of your choice.
|
|